RECEIVE NEWS FROM THE LAB
Sign up for monthly newsError: Contact form not found.
A new study by DataFeedWatch has revealed a number of product flow optimization tactics used by e-tailers to boost campaign performance – and where they go wrong. In fact, we at Adenlab have also analyzed all the flows and errors identified in the Merchant Center to compare the DataFeedWatch study with the flows we manage.
One of the first findings of the study relates to supply. Since the beginning of the pandemic, supply chain problems have caused panic among e-tailers.
On average, 16% of products are out of stock and cannot be purchased by Internet users.
Conversely, 39.40% of French e-tailers will be out of stock, hit at the beginning of 2022 by Omicron’s higher-than-expected inflation.
There are also major disparities between geographical zones. Latin America had one of the lowest levels of stock availability.
These DataFeed Watch statistics are based on information from 4.5 million products, 15,000 e-tailers and over 60 countries.
To conclude this report, we’ve identified some common trends and mistakes, as well as optimizations you can apply to your own product feed for Google Shopping.
What are the 5 most common errors in Google Shopping feeds?
Common feed problems often include missing or incorrect data and poorly formatted attributes. This information is fed back into Google Merchant Center reports and diagnostics.
It is therefore very important to check your Merchant Center account regularly.
Shipping information is responsible for 23.49% of all product rejections by Google Shopping (Merchant Center).
Shipping is the most troublesome aspect of product data configuration. The most common errors are: values that are too high, and unspecified attributes such as the missing shipping country.
Image attribute problems are responsible for 20.32% of all refusals. The level of requirements and quality is high on Google Shopping, and the main image errors include :
- Promotional overlays on images.
- Images too small.
- Missing or invalid images.
- Generic visuals.
GTIN problems account for 5.5% of errors. Sending incorrect GTIN values or omitting GTINs altogether accounts for just over 5% of errors.
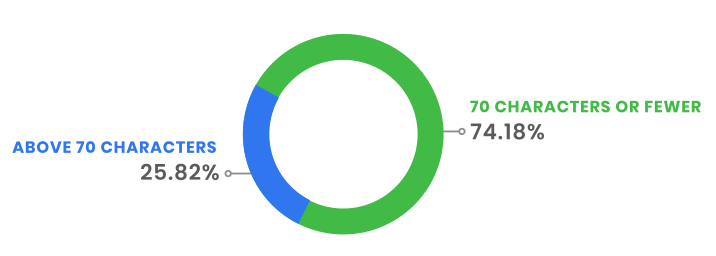
25.82% of ad and product titles on Google Shopping exceed 70 characters. This has an impact on the information displayed for the surfer, as the same title is then cut off in the ad.
In Google Shopping, product titles have a total length of 150 characters, but are cut off after 70 characters. Since 25.82% of Shopping titles exceed 70 characters, important product data may not be visible.

What are the recurring errors on Google Shopping feeds in Adenlab accounts?
The DataFeedWatch study was of particular interest to us, and we wanted to compare its data with that of the accounts we work on.
In fact, the study covers a large number of merchants and products, mentioning 4.5 million products for 15 thousand merchants.
So, let’s start with this silly fact:
- DataFeedWatch: 4.5 million products / 15 thousand merchants: 300 products per merchant
- Adenlab: 425 thousand products / 40 active merchants: 10625 products per merchant
Of course, some accounts have many more products than others, but the fact is that we work on much larger catalogs. Too good Adenlab 😉

And without boasting, let’s take a look at the rejected product rate:
- 3% for accounts managed by Adenlab
- data provided by the DataFeedWatch study (which, as a reminder, is not an agency but a tool for managing and optimizing your flows): the industry average is 7% of rejected items
In fact, what can we see in our accounts?
- The 1st type of error concerns “Non-respect of Google rules”, which accounts for 57% of rejected articles on all accounts.
- the 2nd concerns images with missing values in the attribute, which would be the image link
What are the most common shopping flow optimization techniques?
Most e-tailers use flow tactics to boost the performance of their campaigns. When advertising across multiple channels, different feed data may be required, increasing the likelihood that advertisers will need to tap secondary data sources.
Whether you’re creating new titles or segmenting based on “best sellers” or margins, optimizing data feeds has a positive effect on campaign performance.
Product titles are the most optimized data elements in a product flow. Of all the stores whose data was modified, 14% of these changes concerned product titles. Advertisers either modified several keywords or rewrote titles from scratch.
Two out of five e-commerce advertisers use custom labels to optimize their campaigns. 13% of these advertisers create product groups based on whether the product is on sale or not.
When advertisers segmented their flows according to margins, they saw a 96% increase in ROAS.
64% of e-commerce companies filter out the least profitable products. In almost all cases where merchants cut products, it’s because prices fall below a certain threshold.
Price is the #1 reason for removing products from campaigns. When excluding products from paid advertising based on item price, 90.92% of marketers choose to remove products below a specified price.
Only 9% of marketers filter products by highest price.
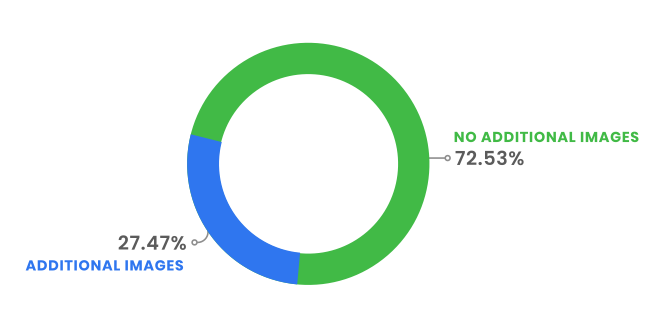
Over 25% of e-tailers provide advertising platforms with additional images. Additional images usually show the product from a different angle or with staging elements. This gives buyers the best possible idea of what they’re buying and how the product can be used.

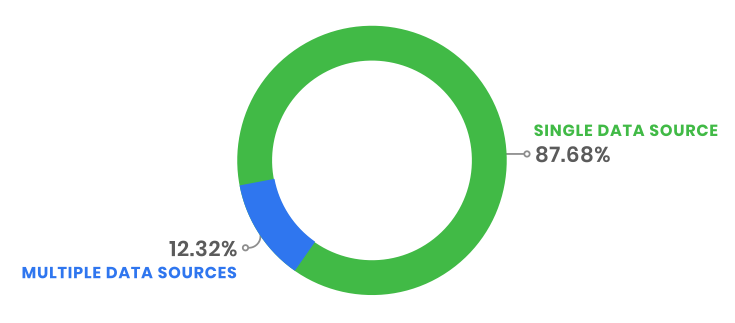
At least one in 10 e-merchant advertisers provides additional product information in the feed by leveraging secondary data sources. The types of secondary data sources used include:
- Inventory management systems
- Analytical
- Google Sheets

You can download the full DataFeedWatch PDF report here. It includes more information on the current state of online shopping, including advice for advertisers on optimizing and improving their feeds, choosing the right platforms and best practices for paid advertising campaigns.


